Recently I joined NG’ class of Machine Learning
Summay of the main topics:
Suprevised Learning
linear regression
通过已有数据,估算线性函数的参数,然后通过自变量X估测因变量y的值。例如在拥有交易数据的情况下,通过房子本身的具体参数预测其市场价格。其中y是连续变量。当仅仅利用原始数据不能给出很好的预测时,可以考虑扩展X,比如原始变量只有x1, x2,扩张后可以包含x1, x2, x1*x2, x1^2 ,x2^2, 这样就可以克服bias的可能性。
logistic regression
当y是二分变量时,比如根据肿瘤的形状估测其是否为恶性肿瘤。这个时候就要使用logistic regression了。思路与linear regression一样,当目标是做出真假的判断。实现的方法是利用logistic curve做变换,转变为linear regression。
neural networks
模拟神经元的作用模式,设置隐藏层,通过估算中间参数来达到预测的目的。
SVM
向量机适用于自变量X不是特比多时,如果有上万个自变量,那么这个时候SVM会很困难。向量机的核函数可以有多种选择,可以是线性的,也可以是gaussain kernel等。
Unsupervised Learning
K-means
聚类分析
PCA
主成分分析
Anomaly detection
异常识别
Special applications/topics
Recommender systems
例如根据用户对影片的评价,向用户推荐合适的影片。这种情景需要循环估算影片参数和用户参数,进而给出合适的推荐。
large scale machine learning
通过算法上技巧将巨型运算分解,如分解到多个计算机,或者分解为多个步骤的小运算。
Advice on building a machine learning system
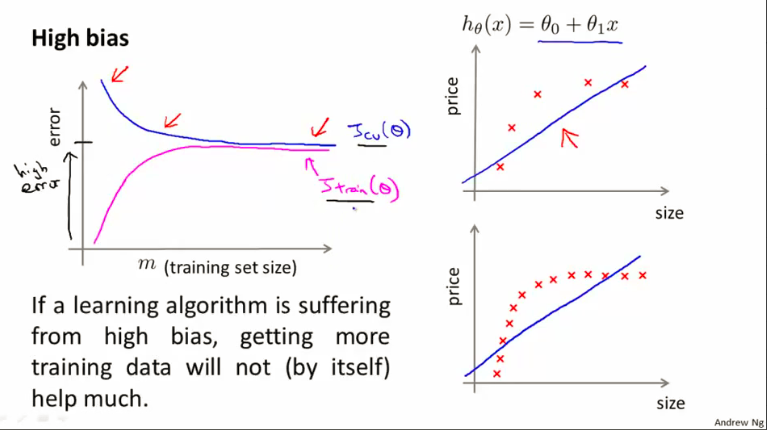
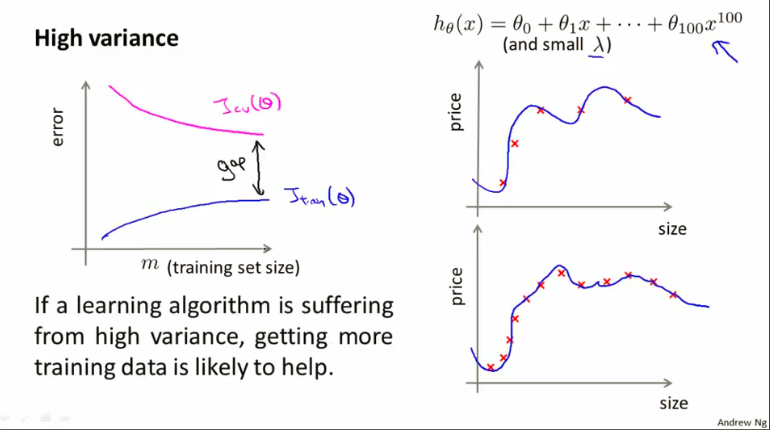
Bias/variance
参考Ng的两张幻灯片。

regularization
通过regularizations参数(如C值,lamda等)的控制,达到既不bias,也不overfit的目的。
deciding what to work on next
从简单开始,不断评估,逐渐优化,寻求正解。
evaluation of learning algorithms
learning curves
error analysis
I类错误:假阴性,明明是,结果预测说不是。
II类错误:假阳性,明明不是,结果预测说是。
Precision=truePositive/(truePositive+falsePositive)
Recall=truePositive/(truePositive+falseNegtive)
F score=2PR/(P+R)
通过F值可以在两者之间得到平衡,F值越大两者兼顾越好。
ceiling analysis
picture notes: G:\myfile\img\machinelearning
Octave basics
Here is the Basic Commands from Ng’s class notes
PS1('>> '); % make pre short
1==2 %false
1~=2
1 && 2 % AND
1 || 0 % OR
xor(1,0) % OR
a=3; % semicolon supressing output
b='hi';
disp(sprintf('2 decimals: %0.2f',a))
a=pi;
format long
format short
A=[1 2; 3 4; 5 6]
ones(3,1)
zeros(1,3)
rand(1,3)
hist(-6+sqrt(10)*(randn(1,10000)))
size(A,1)
save hello.txt v -ascii % save as text
eye(6)
length(A)
load featuresX.dat
load priceY.dat
load('featuresX.dat')
who
clear priceY
clear
v=priceY(1:10)
A(3,1)
A(2,:) % ":" means every element along that row/column
A([1 3],:) % get 1,3 row
A(:,2)=[10;11;12]
A=[A,[100;101;102]]
A(:) % put all elements into a single vector
C=[A B]
C=[A; B]
sum(A)
prod(A)
floor(A)
ceil(A)
max(A,[],1)
max(A,[],2)
max(A)
flipud(eye(9))
t=[0:0.01:0.98]
y1=sin(2*pi*4*t);
y2=cos(2*pi*4*t);
plot(t,y1);
plot(t,y2,'r')
xlabel('time')
ylabel('value')
legent('sin','cos')
title('my plot')
print -dpng 'myPlot.png'
close
figure(1);plot(t,y1);
figure(2);plot(t,y2);
subplot(1,2,1); % divides plot a 1x2 grid, acce
axis([0.5 1 -1 1]) & x [0.5 1] y[-1 1]
clf;
imagesc(A)
imagesc(A), colorbar, colormap gray;

indices=1:10;
for i=indices,
   disp(i);
end;

i=1;
while i <=5;
  v(i)=100;
  i=i+1;
end;

i=1;
while true,
  v(i)=999;
  i=i+1;
  if i==6,
    break;
  end;
end;

v(1)=2;
if v(1)==1,
  disp('equal one')
elseif v(1)==2,
  disp('equal two')
else
  disp('not one or two')
end;

pwd
ls

addpath('C:users\ang\Desktop') % add octave search path
mlclass-ex4-004 and mlclass-ex4-003 can be used in Application Example: Photo OCR

