I met this problem when I was analysing teachers’ PCK concept maps. I wanted to divide them into several clusters that shared the similar structures(nodes and links).
One approch is plotting them in a 2d picture to see if there is any patterns. But before that, you have to do the Muultidimensional Scaling to get your (x,y) from your Distance Matrix.
Distance Matrix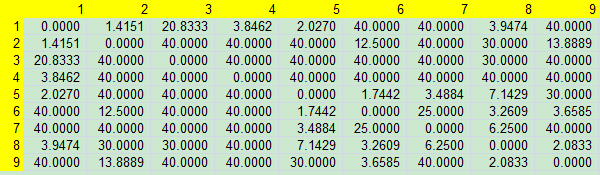
How I got this matrix. Well, I just count them using my data. Of course, if can deside how you count them, which counts how much score, or you simply give them a number.
# 1) MDS 'cmdscale'
dm <- read.table("distance-matrix.txt")
mds1 = cmdscale(dm, k = 2)

# plot
plot(mds1[,1], mds1[,2], type = "n", xlab = "", ylab = "", axes = FALSE, main = "cmdscale (stats)")
text(mds1[,1], mds1[,2], labels(x)[[1]], cex = 0.9, xpd = TRUE)
This the x y data I got: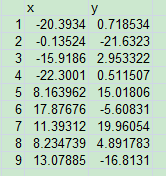
I got this picture after plotting it out.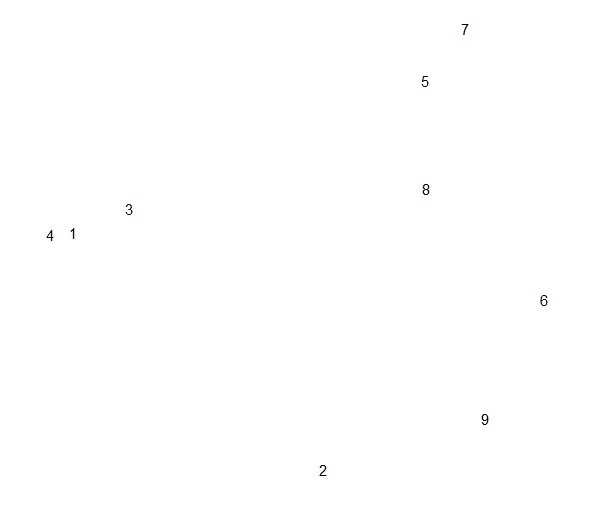
Reference:
7 Functions to do Metric Multidimensional Scaling in R | Gaston Sanchez